Johannes Lampel - Projects/Profiler
In-Game Realtime Profiler :Often it is very useful where most of the time of your calculation time is spent. There are different ways to do this : You can use third party programs like the AMD CodeAnalyst, or you can use an own, in game, realtime profiler.
Third party profiler like the AMD CodeAnalyst are easy to use,
have a lot of functions to analyse the resulting data and multible possibilities
to export the data. Those programs often work by sampling where the execution
of the program is with a fixed frequency. This produces a lot of data and eventually
needs a lot of additional processing time, while they are not always successful
in analysing functions which are only executed during a shot timespan,
because the sampling rate is relatively low, otherwise we would just get too
much data. To get a better resolution, the time of measurement needs to be extended.
Unfortunately those average values do not neccessarily show functions using
a lot of time only at certain moments.
The profiler of JoeBOT XP works another way ( based on Steven
Rabin / Game Programming Gems 1 / ’Real-Time In-Game Profiling’
) : We have one global instance of the profiler for managing all data, being
called by so called CProfileItem instances. Those CProfileItem instances do
a profiler call when being created, i.e. from their constructor, and call a function
of the global profiler instance when destructed. This way we can just create
an instance of
such a CProfilerItem in a function to be profiled. Every time this function
is called, the variable is instantiated, therewith the time measurement started.
When we exit that function, the variable is destructed and the time measurement
is done. The task of the main profiler class is to collect this data, to maintain
a tree representing the calling hirarchy and to do some simple calculation showing
the average time spent, maximum time etc. Finally we have functions to implement
some cursor like system to browse the tree and a function to output this text
to a buffer.
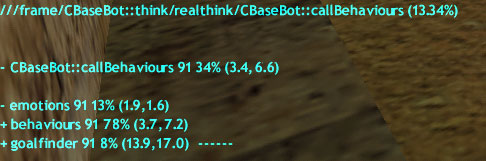
Example Output from JoeBOT XP
This profiler uses the HPTime class for time measurements.
Source code:
Profiler.cpp
Profiler.h